Metrics
The Metrics module provides a comprehensive view of vital server metrics and visualizations, enabling you to monitor and analyze the present and past states of your database server. Please note that this module is currency in the beta phase, and we anticipate frequent changes and improvements.
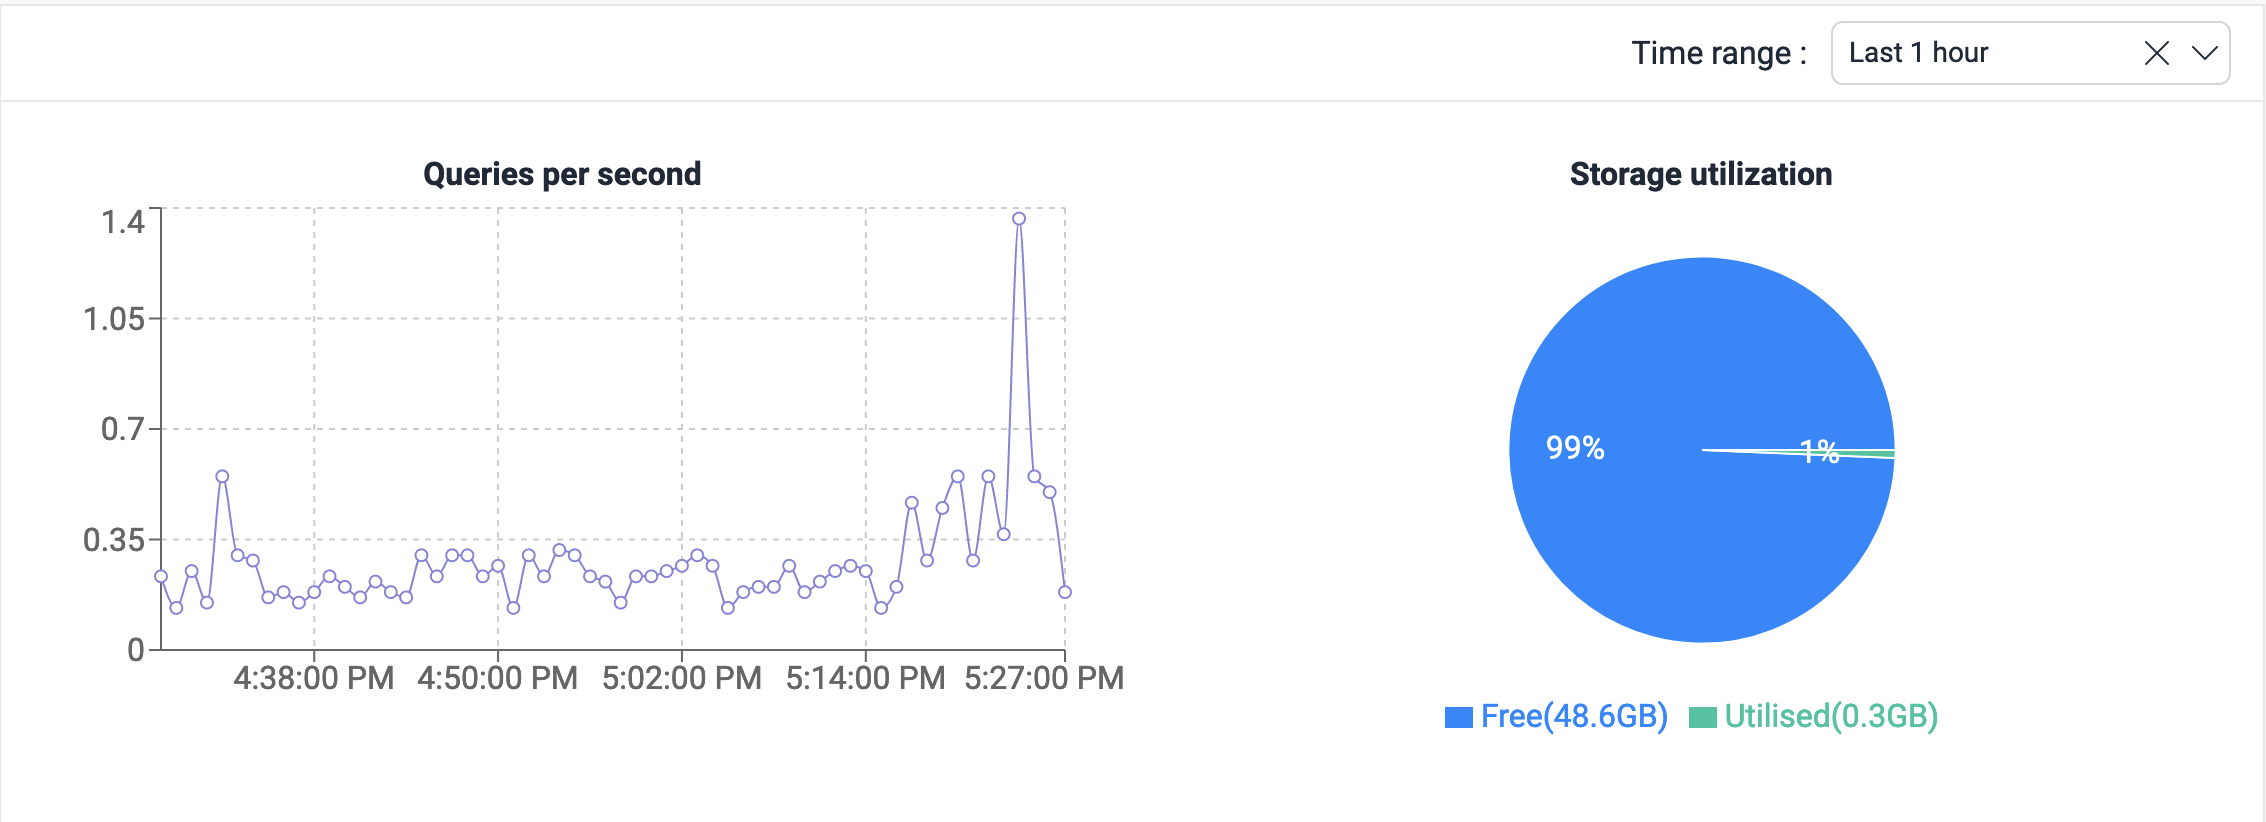
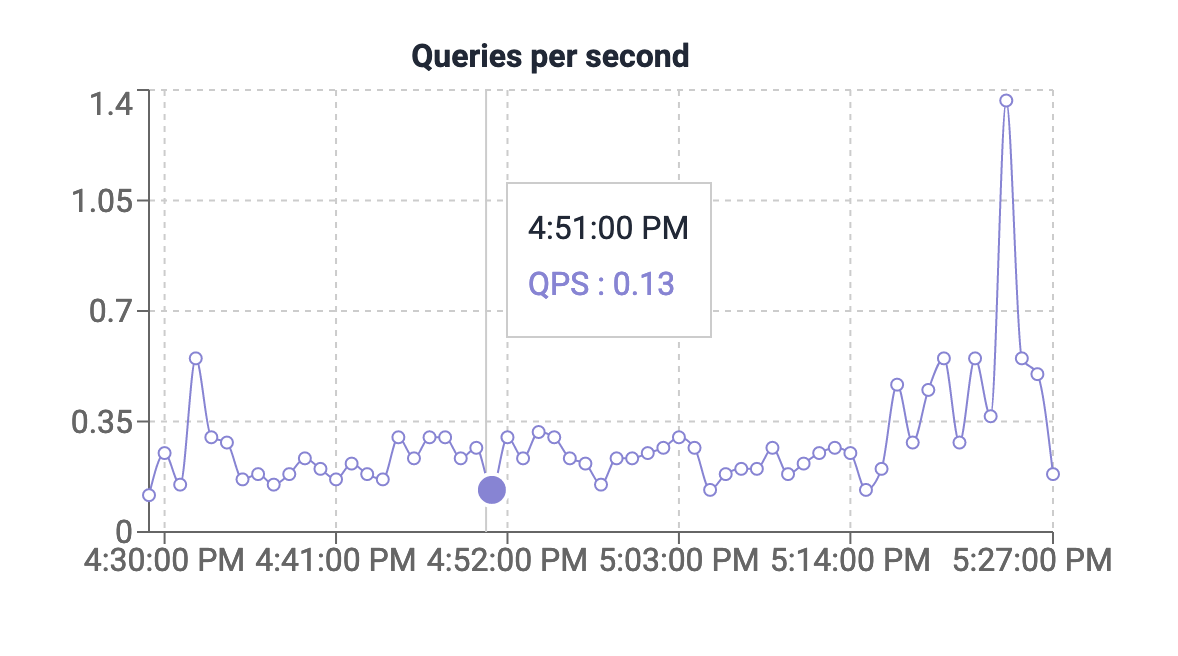
Queries per Second
The “Queries per Second” metric represents the rate at which queries are executed on your database server. This metric helps you understand the workload on your server and identify peak usage periods.
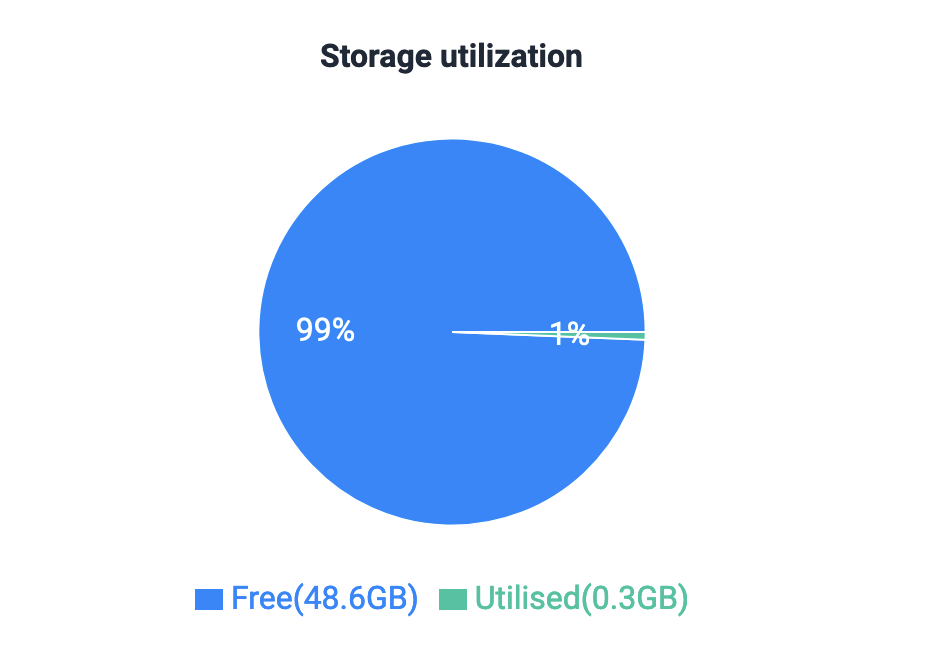
Storage Utilization
“Storage Utilization” provides insights into the amount of storage space your database is currently using. This metric can help in monitoring and planning the storage capacity for future needs.
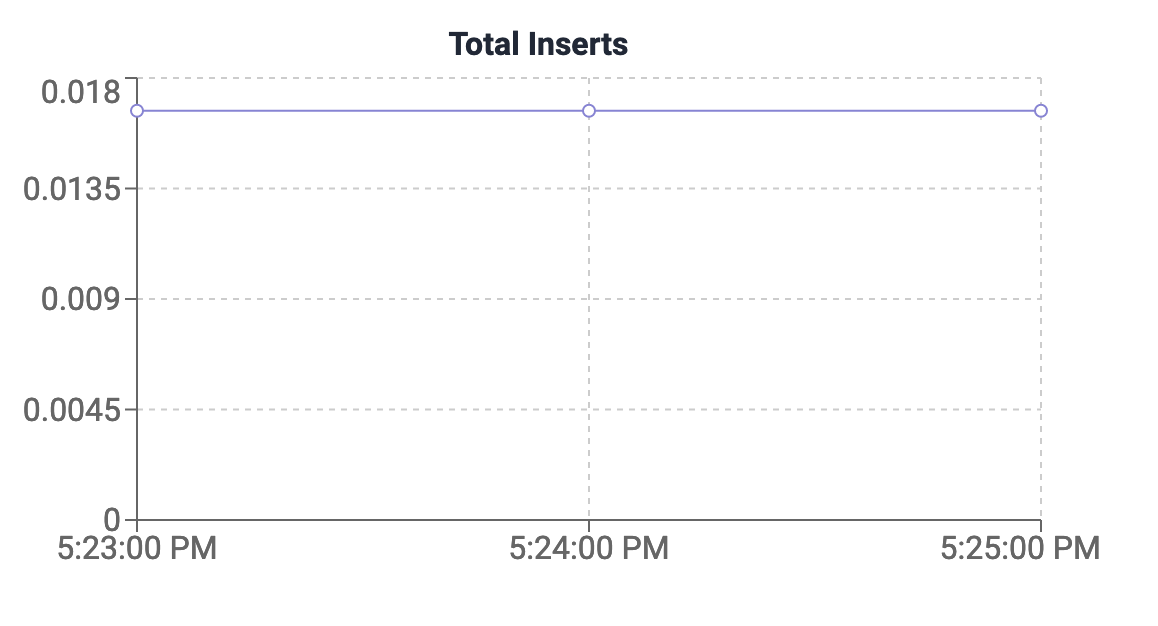
Total Inserts
This metric displays the total number of insert operations performed on your database. Tracking this value is crucial for understanding data insertion patterns and detecting anomalies.
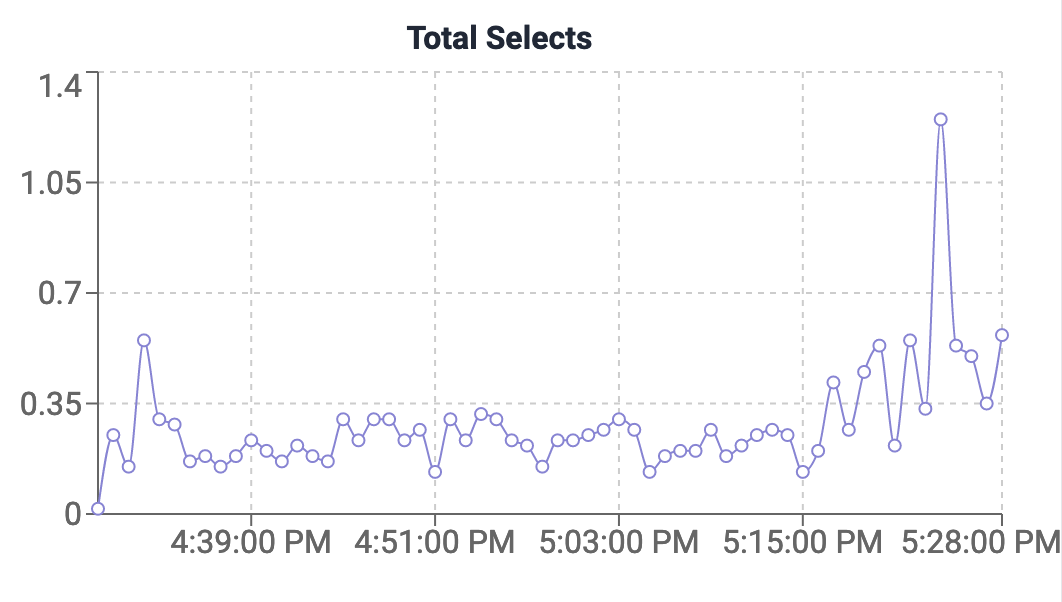
Total Selects
“Total Selects” represents the cumulative count of select queries executed on your database. Monitoring this metric is essential for evaluating read-intensive operations.
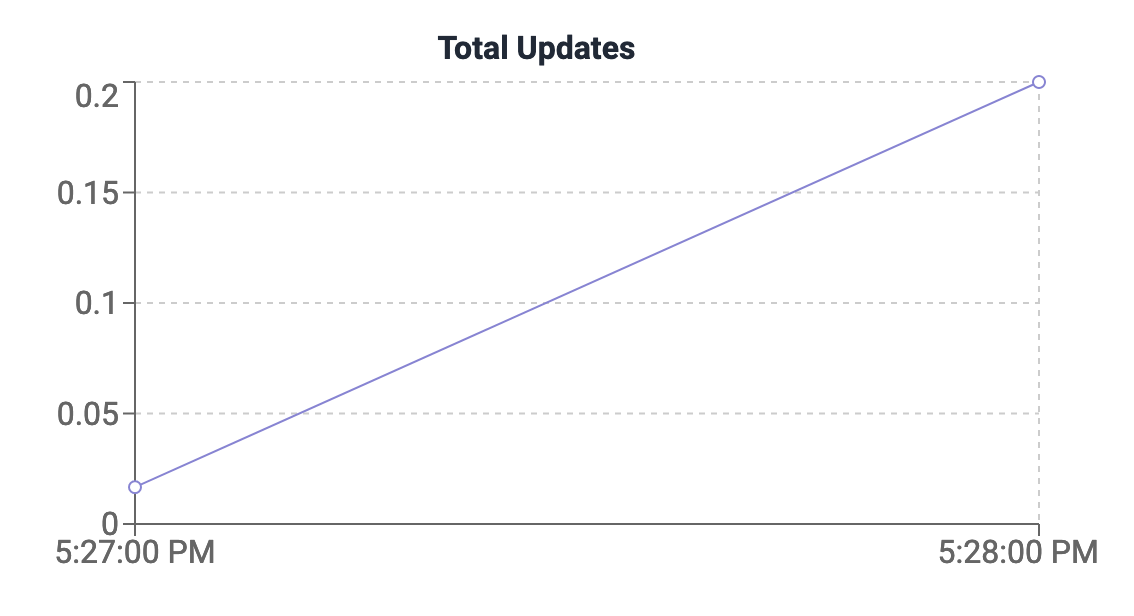
Total Updates
This metric indicates the total number of update operations carried out on your database. Keeping an eye on this value helps you assess the frequency of data modifications.
Failed Queries
“Failed Queries” represents the number of queries that encountered errors during execution. Monitoring this metric helps in investigating the potential issues and performance bottlenecks.
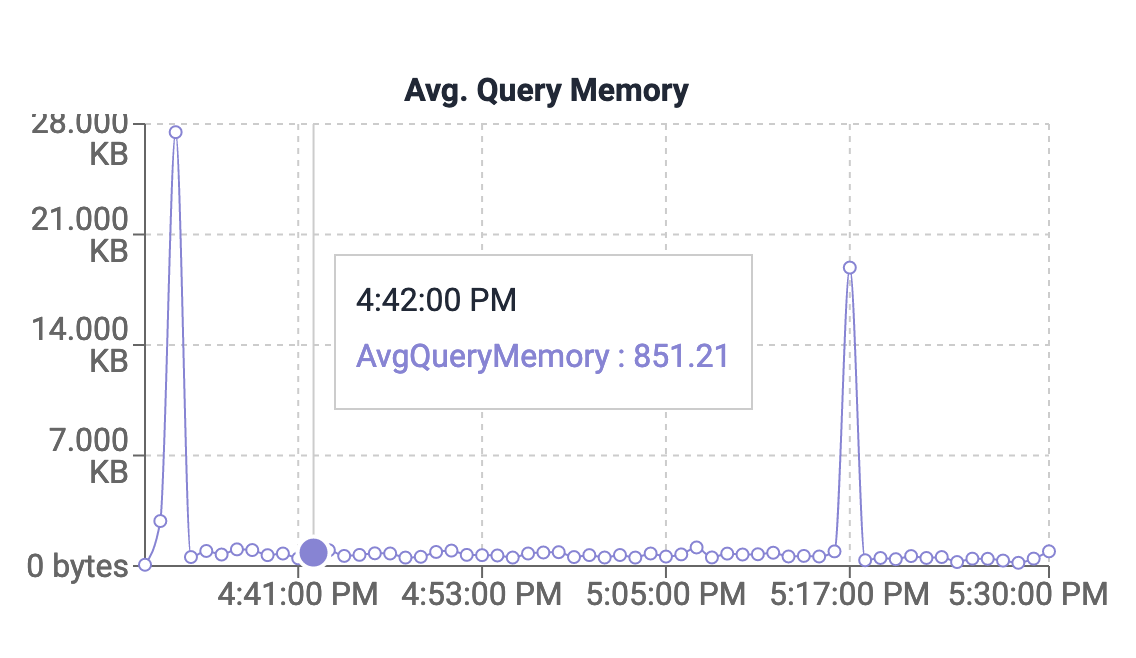
Average Query Memory
The “Average Query Memory” metric provides insights into the average amount of memory consumed by queries. This information is valuable for optimizing the queries for lower or reduced memory usage and enhancing overall system performance.
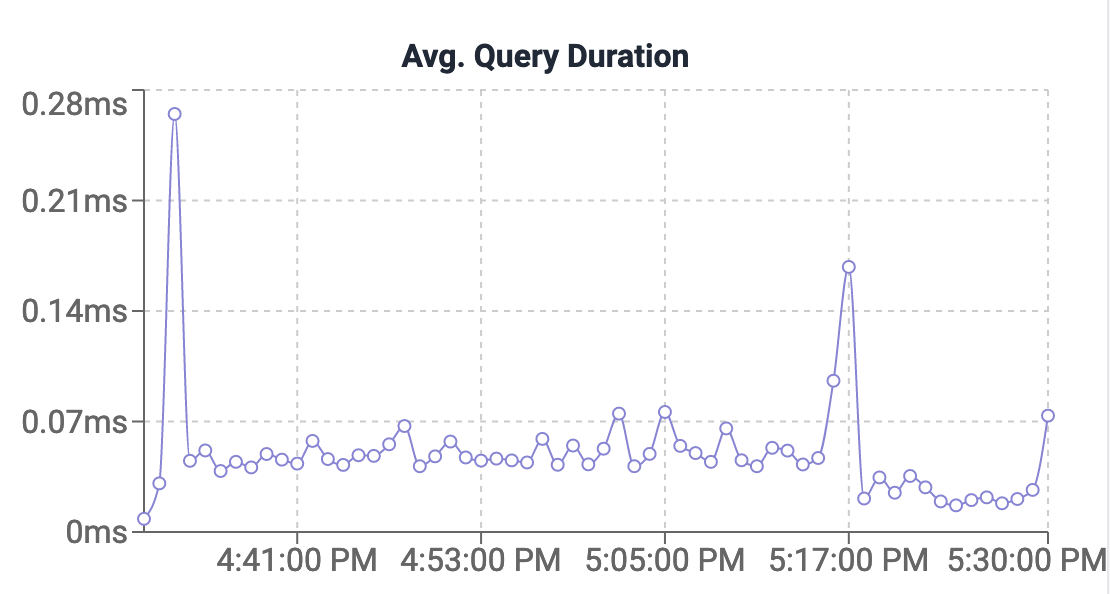
Average Query Duration
This metric displays the average time taken for queries to execute. Monitoring the “Average Query Duration” helps you to proactively identify and address slow-performing queries, ensuring optimal system responsiveness.
